
Gawler House Prices in 2026 — Where the Market Stands
The Gawler district — around 40km north of Adelaide's CBD — recorded a median house price of $777,500, based on 20 confirmed sales between 4 June and 3 July 2026, down from May's 46 sales as buyer demand eased and stock rose.
The more important story: the three-bedroom market has held at exactly $700,000 for three consecutive months without moving a dollar. May's activity was unusually strong — 46 confirmed sales running directly counter to the district's established winter pattern — and June's correction confirms the market has settled into a more typical winter footing.
Andrew McKiggan (RLA248695) at Gawler East Real Estate compiles this report monthly from confirmed realestate.com.au sold records and provides free property appraisals across all Gawler district suburbs — with 1.5% commission or lower and no hidden fees.
Gawler District — Current House Prices
Last updated July 2026 · Based on confirmed sales 4 June to 3 July 2026 · Updated monthly
| Market Indicator | Current Figure |
|---|---|
| Median House Price | $777,500 |
| 3-Bedroom Median | $700,000 |
| Most Active Price Band | $700,000–$749,999 |
| Total Sales (June 2026) | 20 confirmed sales |
| Market Condition | Easing — seasonal winter slowdown confirmed |
Want the full suburb-by-suburb breakdown?
This page tracks the current monthly figure. Our annual review compares growth, sale volume, and market reliability across all eleven Gawler-district suburbs.
Gawler Property Market — What Sold in June 2026
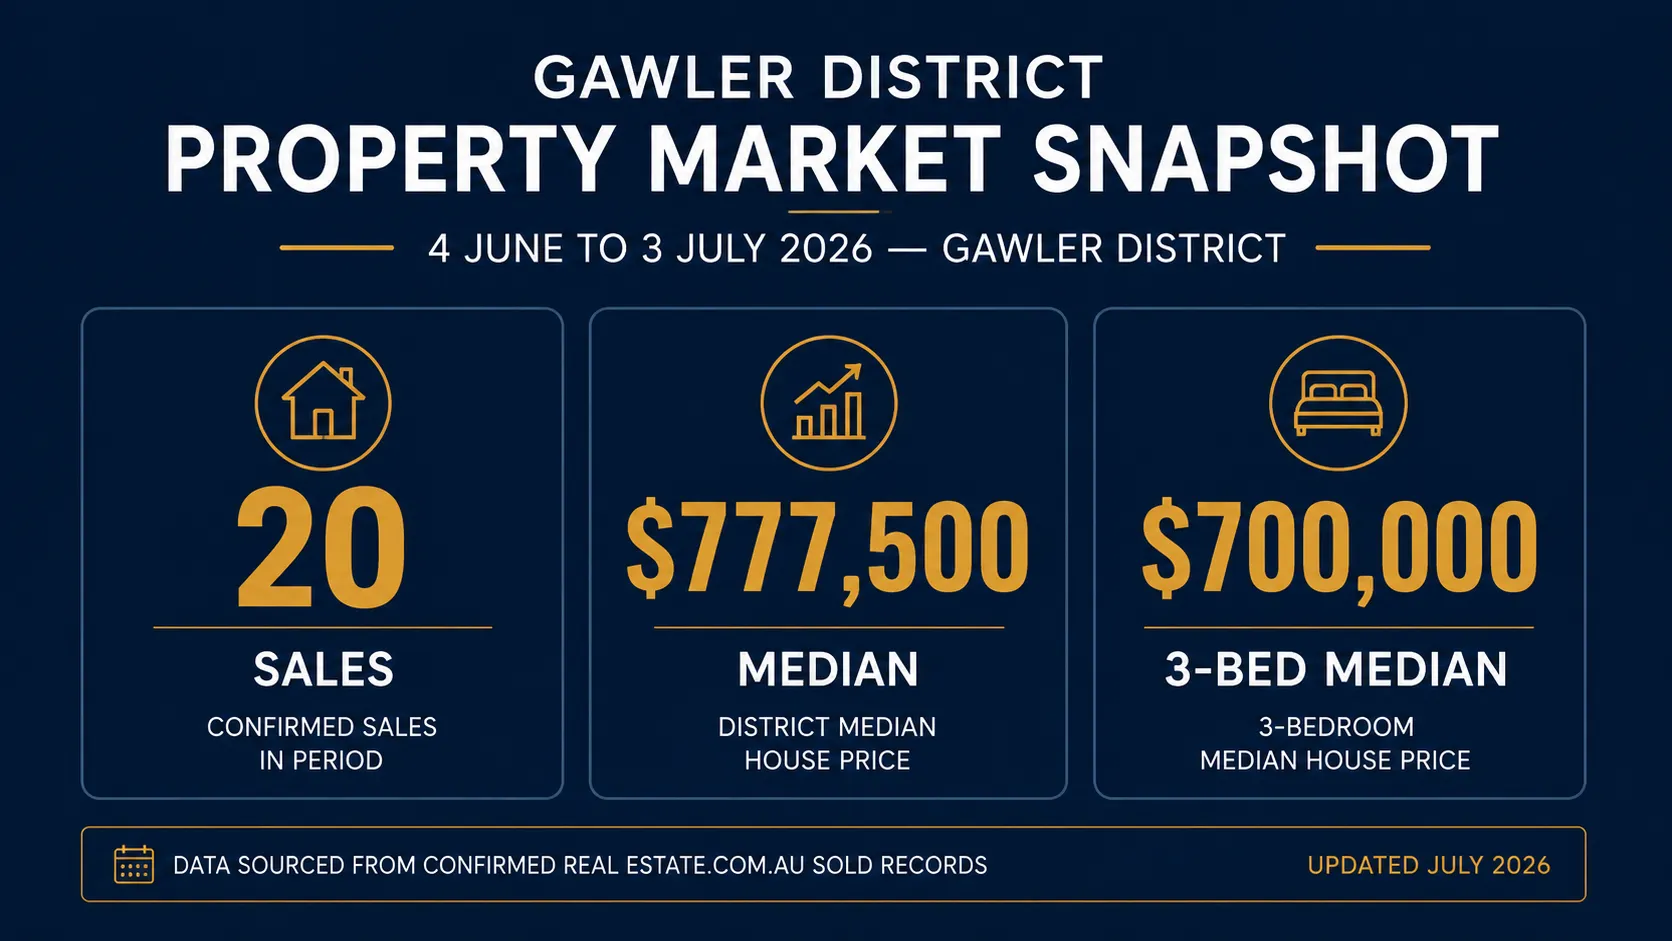
The Gawler district recorded 20 confirmed residential sales between 4 June and 3 July 2026 — a significant step down from May's 46. Of those, 16 disclosed a sale price, producing a district median of $777,500. The Gawler district covers Gawler, Gawler East, Gawler South, Gawler West, Hewett, Willaston, Evanston, Evanston Gardens, Evanston Park and Gawler Belt.
This step-down is a clear signal that the winter slowdown the market skipped in May has now arrived.
Supply has not eased with demand. Approximately 243 houses with three or more bedrooms were listed across the district and surrounds as of late June 2026 — up from 238 in early June, and higher than is typical for this time of year. With a thinner buyer pool and more stock competing for attention, listing strategy is now the critical variable for vendors. This month's report covers the specific mistakes we are currently seeing in the market — and what they are costing.
For the full breakdown of every confirmed sale this period, see the Houses Sold in Gawler — June 2026 monthly report.
Why Gawler House Prices Can Be Misleading — The Dual-Speed Market
Before reading any Gawler price figure, this is the most important thing to understand: Gawler does not operate as a single uniform market.
The district runs at two different speeds, with two different price drivers:
The Historic Township Core
Church Hill and Gawler Central — heritage overlays, period stone cottages, low transaction volumes. A handful of sales can move the suburb median significantly in either direction, not because values have shifted, but because the sample is too small to carry statistical weight.
The Growth Corridors
Gawler East, Evanston Gardens, Evanston Park and surrounding areas — modern master-planned housing, consistent buyer activity, affordability-driven demand. Gawler East alone regularly accounts for 25–30% of all district sales in any given month, giving its median genuine statistical weight.
That divide shows up clearly in the annual figures too — over the past 12 months, Gawler East (one of the growth corridors above) grew +13.1%, while Gawler township itself, sitting in the low-volume historic core, fell -10.9% on just 15 sales. See the full 2026 Suburb Growth Comparison for the complete eleven-suburb breakdown, including Hewett's standout +22.5% result.
A suburb median based on 2 sales is not the same signal as one based on 12. The district-wide headline median must always be read alongside the sale count and the price band distribution. For a detailed structural analysis of the Gawler market including development pipeline, commute infrastructure and long-term demand drivers, see our Gawler Property Market Overview.
What Is the Median House Price in Gawler SA?
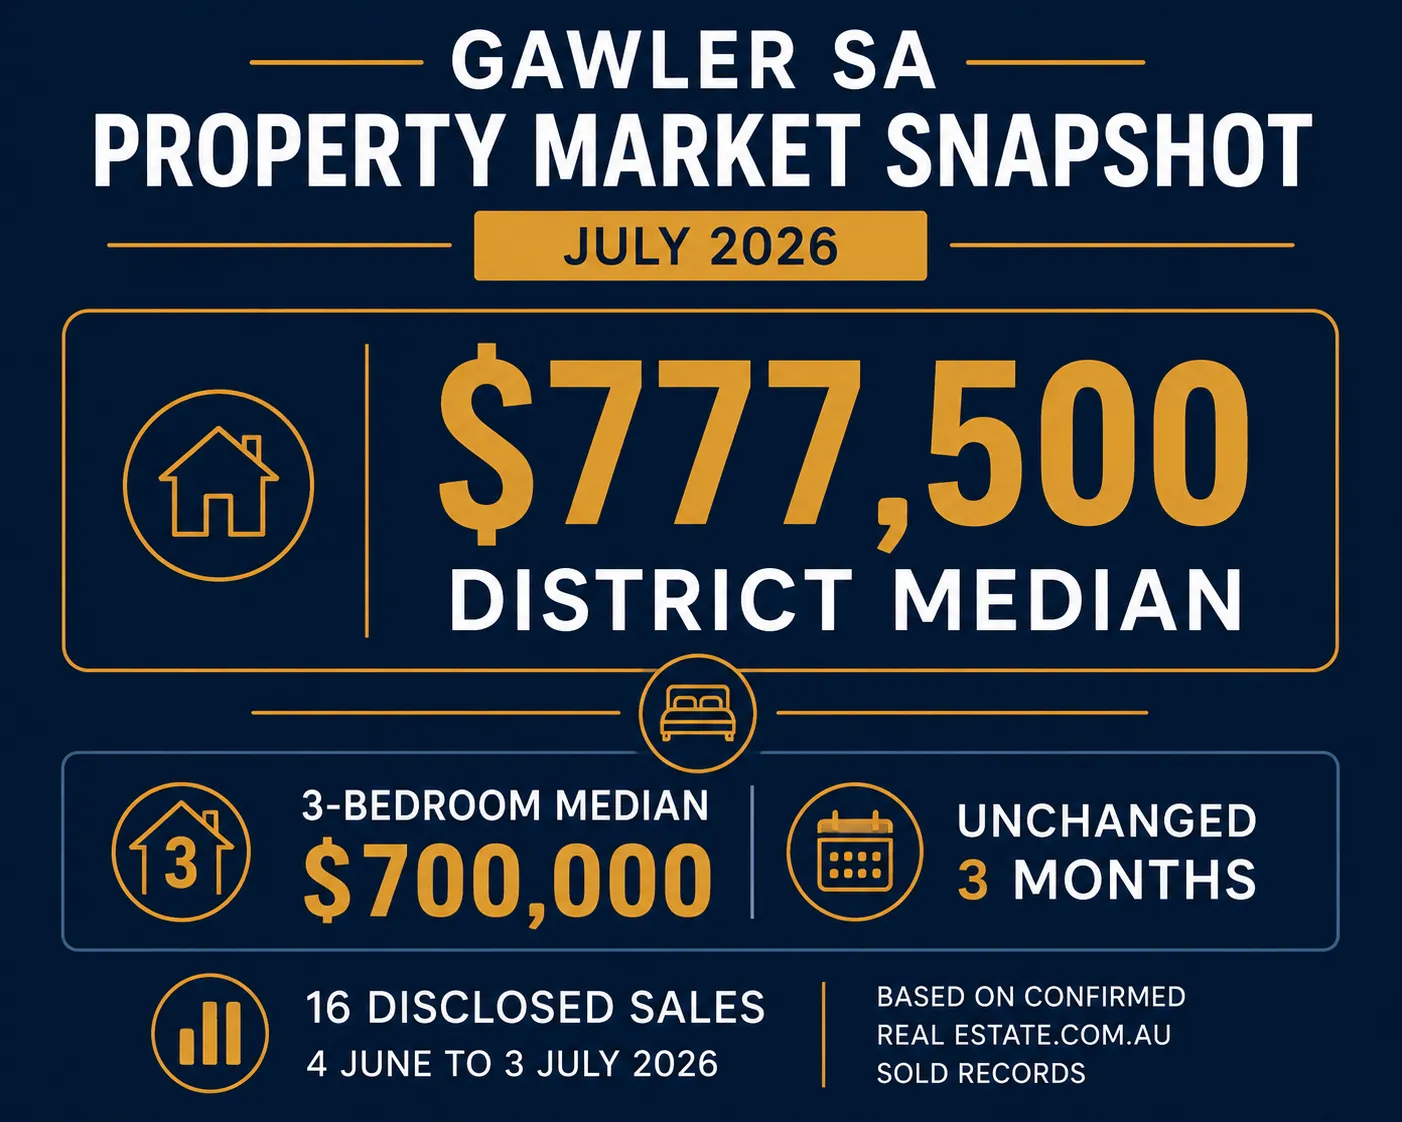
The current district median is $777,500 — based on 20 confirmed sales between 4 June and 3 July 2026, with 16 disclosing a sale price. June recorded the thinnest sample of this report series, so the headline median carries more than usual composition sensitivity.
This figure is compiled from confirmed sold listings on realestate.com.au — not from an automated valuation model like those used by PropTrack, CoreLogic or portal "estimated value" tools. Automated estimates update more frequently but are algorithm-generated, which is why they can differ from the confirmed settlement figure reported here.
But here is what the headline number alone won't tell you:
The small-sample effect. With only 16 disclosed sales, a single large result — such as the $1,220,000 Gawler Belt acreage sale or the $1,150,000 Gawler East result — has a measurable pull on the district median. Read this figure alongside the price band table below, not in isolation.
The stable core. The $700,000–$749,999 band recorded 5 of 16 disclosed sales — 31% of all transactions. The mid-range residential market has not moved in three months. That is the more useful signal for most buyers and sellers.
The headline median tells you what the full range sold for.
The price band distribution tells you where the market actually operates. The three-bedroom median of $700,000 — held across April, May and June from 43 combined disclosed sales — is the number worth anchoring to.
What Is the Price Distribution of Houses Sold in the Gawler District?
Most Gawler district home sales in June 2026 fell within the $700,000–$749,999 band — 5 of 16 disclosed sales, 31% of all transactions. The full breakdown below shows where transactions are actually occurring across the district, which is more useful for buyers and sellers than any single median figure. Bands with zero sales this period are shown for consistency across the series; their absence this month reflects the thinner overall volume rather than a shift in the market structure.
| Price Band | Sales | Market Interpretation |
|---|---|---|
| Under $600,000 | 0 | No confirmed sales this period |
| $600,000–$649,999 | 2 | Entry-level — Willaston and Evanston |
| $650,000–$699,999 | 0 | No confirmed sales this period |
| $700,000–$749,999 | 5 | ★ Most active band — 31% of all disclosed sales |
| $750,000–$799,999 | 2 | Upper mid-range — Gawler East and Evanston Park |
| $800,000–$849,999 | 0 | No confirmed sales this period |
| $850,000–$899,999 | 2 | Quality family homes — Gawler East |
| $900,000–$999,999 | 2 | Premium — upper Gawler East |
| $1,000,000–$1,099,999 | 1 | High-value — Gawler East prestige |
| $1,100,000–$1,299,999 | 2 | Top-end — Gawler East prestige and Gawler Belt acreage |
| $1,300,000+ | 0 | No confirmed sales this period |
| Total | 16 | Disclosed sales — 4 June to 3 July 2026 |
The concentration extends beyond the single most active band. The combined $700,000–$799,999 range accounted for 7 of 16 disclosed sales — 44% of all transactions. The core residential market is anchored here regardless of what the headline median is doing.
The absence of sales below $650,000 and above $1,300,000 this period reflects the thinner buyer pool rather than a structural gap in the market — both segments have transacted in recent months and will again as volume recovers.
Are Gawler House Prices Rising or Falling? — April, May and June 2026 Compared
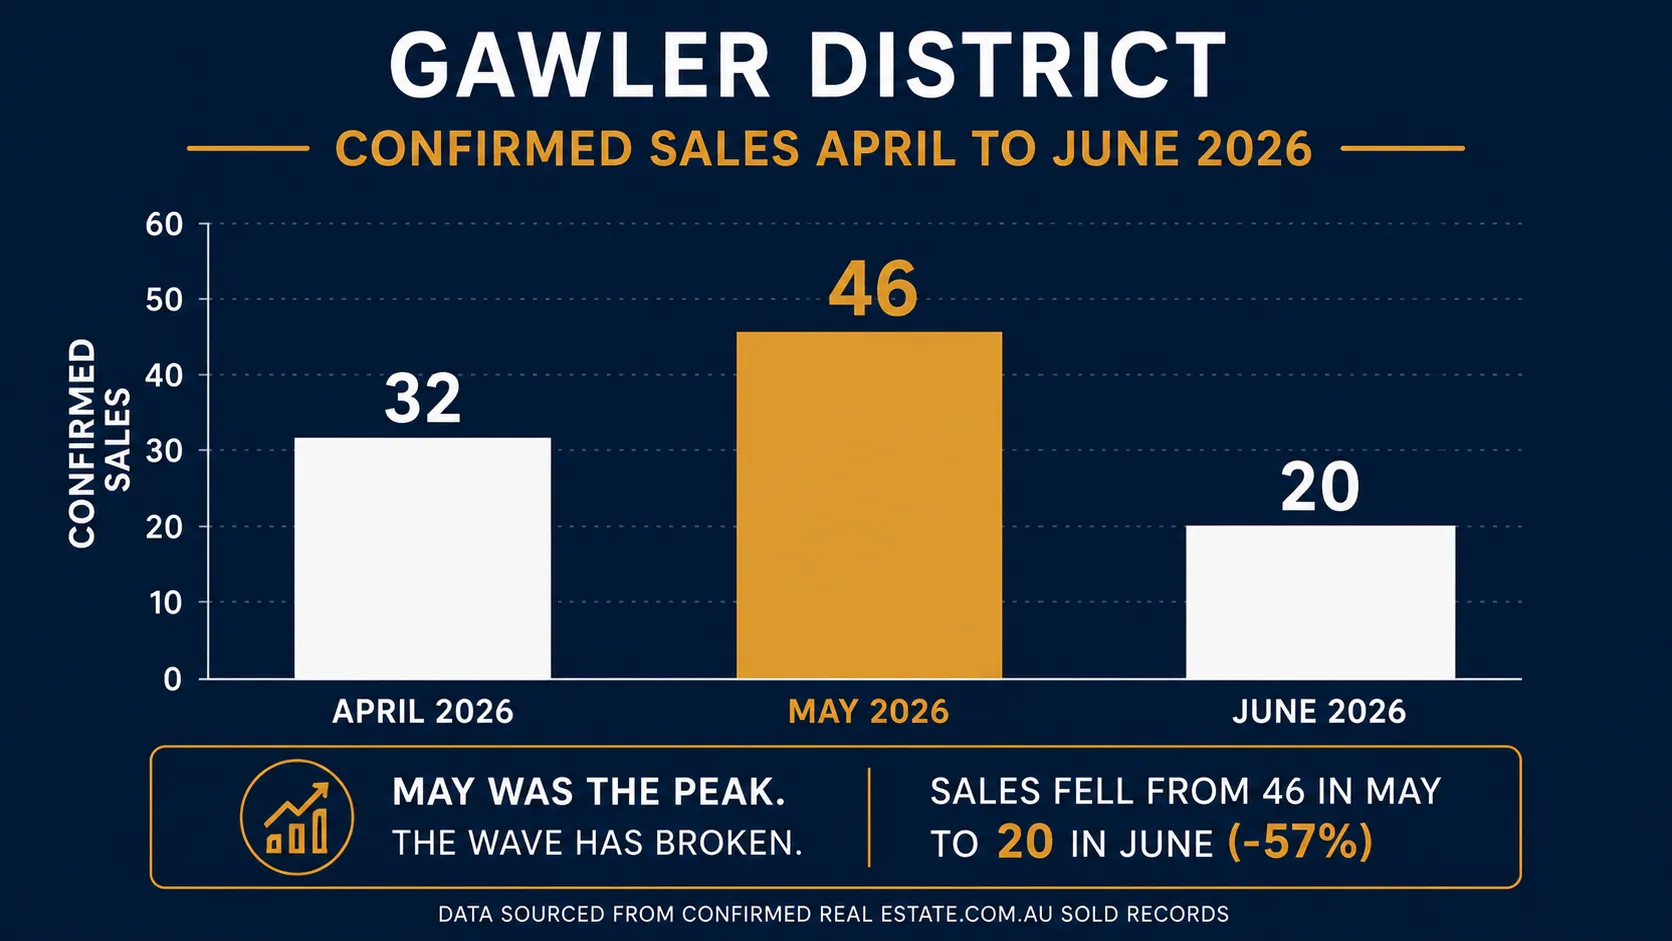
Gawler house prices have held steady rather than clearly risen or fallen over the past three months. The 3-bedroom median — the most reliable read on the core market — stayed at exactly $700,000 across April, May and June 2026, while the headline district median swung between $717,750 and $790,200 due to which suburbs and price tiers happened to transact each month, not genuine price movement. With three full monthly periods now confirmed, the picture is clearer than any single month can show: April established the baseline, May was the anomaly, June is the correction.
| Metric | April 2026 | May 2026 | June 2026 | Trend |
|---|---|---|---|---|
| Total Sales | 32 | 46 ▲ | 20 | Surge then correct |
| Disclosed Sales | 26 | 42 | 16 | — |
| Median House Price | $717,750 | $790,200 | $777,500 | Composition-driven |
| 3-Bedroom Median | $700,000 | $700,000 | $700,000 | — Rock solid |
| 4-Bedroom Median | $815,000 | $970,000* | $755,500 | Composition-driven |
| Most Active Band | $700k–$749k | $700k–$749k | $700k–$749k | — Unchanged |
| Gawler East Median | n/a | $770,000 (12) | $899,500* (6) | Premium skew Jun |
| Hewett Median | $910,000 (1) | $1,008,000 (6) | 0 sales | 5 of 10 under offer |
| Stock (3+ bed listed) | — | ~238 | ~243 | ▲ Edging up |
* May 4-bed median inflated by premium Hewett concentration. June Gawler East median pulled upward by the $1,150,000 Cheek Avenue result — remaining 5 sales ranged $712,500–$932,000.
The three-month picture resolves what a single month cannot. Headline medians have moved between $717,750 and $790,200 — but the $700,000–$749,999 band has been the most active bracket in all three months without exception. Everything else in the headline figures is composition noise driven by which suburbs and price tiers happened to transact each month.
What the 4-bedroom swing is actually telling you. May's $970,000 4-bedroom median reflected four Hewett sales above $1,000,000. June's $755,500 reflects an ordinary mid-range mix with no equivalent premium concentration. Neither figure is wrong. The April figure of $815,000 from a more representative sample is the most useful reference for most 4-bedroom sellers.
Gawler House Prices Quarter on Quarter — Is the Market Slowing?
The Gawler market slowed in transaction volume over the Feb–May 2026 quarter, but not in underlying prices. Total sales fell from 101 to 90 and the headline median dipped $35,000 — but the 3-bedroom median rose $5,000 and the 4-bedroom median rose $9,000 over the same period. That split is the clearest evidence that the quarterly change reflects fewer transactions, not falling values.
| Metric | Feb–May 2026 | Nov 2025–Feb 2026 | Movement |
|---|---|---|---|
| Total Sales | 90 | 101 | ▼ -11 |
| Disclosed Sales | 73 | 89 | ▼ -16 |
| Median House Price | $740,000 | $775,000 | ▼ -$35,000 |
| 3-Bedroom Median | $710,000 | $705,000 | ▲ +$5,000 |
| 4-Bedroom Median | $845,000 | $836,000 | ▲ +$9,000 |
| Most Active Band | $700k–$749k | $700k–$799k | Tighter core |
| Gawler East Median | $830,000 (21) | $821,000 (28) | ▲ +$9,000 |
The quarter-on-quarter picture reflects the expected seasonal transition from the peak spring-summer window into the cooler autumn months. The $35,000 drop in the rolling median between periods is a seasonal composition effect — fewer premium Gawler East transactions in the autumn window and lower overall volume.
The bedroom medians tell a different story. 3-bedroom homes strengthened $5,000 and 4-bedroom homes strengthened $9,000 across the same period. The headline median softening is a seasonal volume effect, not a signal of falling prices in the core family-home segments.
How Has the 2026 Federal Budget Affected Gawler House Prices?
The 2026 federal budget triggered a temporary spike in Gawler sales volume in May, followed by a sharp correction in June. May's investor incentive announcements drove sales to 46, up from April's 32 — but June returned to just 20 sales while the 3-bedroom median held at $700,000 throughout.
Last month we set a clear test: if June volumes held above seasonal norms, the budget-driven buyer surge was sustaining activity; if June fell back, May was a pull-forward. June came in at 20 sales. May was a pull-forward.
The budget's investor incentive announcements created a concentrated window of buyer urgency. The cohort most responsive — mid-tier buyers and investors in the $650,000–$850,000 bracket — moved in May. They are now out of the active market.
What remains is a smaller pool of buyers, predominantly owner-occupiers and longer-horizon investors, transacting against a rising stock count. Open home attendance has softened noticeably during the critical first two weeks of new campaigns — the window when genuine buyer interest is highest and when most campaigns either build momentum or lose it.
Some of that softness is seasonal. Some of it reflects that the most motivated buyer cohort already purchased in May.
Rising stock, easing demand — what this means for vendors right now
Approximately 243 houses with 3+ bedrooms are currently listed across the Gawler district and surrounds — up from 238 in early June, and higher than is typical for this time of year. Listings are accumulating faster than they are being absorbed.
A property that launched before May's listing flood had natural page-1 exposure on realestate.com.au. One launching now competes against 243 others for the same buyer attention. The window where a listing sits on pages 1–3 — where the overwhelming majority of buyer traffic concentrates — is shorter than it was three months ago. The remedy is not to wait. It is to price and present correctly from day one.
For the full analysis, see: 2026 Federal Budget — Gawler Property Market Analysis.
Hewett House Prices — Zero June Sales, But Don't Read Into It
Hewett recorded zero confirmed sales in June 2026 — but that doesn't signal a cooling suburb. Five of Hewett's ten active listings are currently under offer and are likely to appear as confirmed sales in July's data. The absence follows a strong May, when the suburb delivered six disclosed sales and a landmark $1,008,000 median.
Properties currently under offer typically move to confirmed settlement within four to six weeks in the current market, meaning several of these results should surface in next month's confirmed data.
The other factor worth understanding is price point. Hewett's established homes predominantly transact between $900,000 and $1,100,000. Buyers at this level inspect multiple times, finance at larger loan values, and conduct more thorough due diligence before signing. A longer sale cycle here is not a market signal — it is a normal feature of premium residential transactions.
Hewett in context
10 active listings. 5 under offer. Zero confirmed sales in June — but up to five potentially landing in July's data. The suburb has not gone quiet. It is processing.
Angle Vale House Prices — More Choice for Buyers Than Anywhere Else in the District
Angle Vale currently has 56 properties listed for sale — the largest stock of any suburb in the Gawler district — giving buyers more genuine choice here than anywhere else right now. The median house price sits at $837,000, up 10.0% over the past 12 months, Angle Vale's first year included in this report.
Angle Vale is one of the largest and most distinctive suburbs in the dataset, spanning over 14 square kilometres, with the fastest population growth in the district — up 38.6% since 2016. Its premium median reflects larger blocks and a lifestyle-acreage feel that sets it apart from the more compact growth-corridor suburbs nearby.
Sales here move noticeably slower than the district average, at 39 days on market — though that average is stretched by the suburb's premium-priced acreage listings, which typically take longer to sell than mid-range stock. A home in Angle Vale's core price band will often move faster than the headline figure suggests.
Angle Vale in context
56 properties listed — the most of any suburb. Median $837,000, up 10.0% in 12 months. With new estates still being released and demand showing no sign of slowing, Angle Vale is one of the few pockets in the Gawler corridor where buyers can still land a newer build without the price tag of an established suburb. For the full picture see our Angle Vale House Prices report.
What Is the Best Time to Sell in Gawler?
Right now, the ratio in Gawler favours buyers over sellers — approximately 243 houses currently listed against around 20 confirmed sales a month. That doesn't mean it's a bad time to sell. It means execution matters more than it did in May: well-priced, well-presented properties are still achieving strong results, but the margin for error is narrower.
Spring historically brings stronger buyer volumes to the Gawler district — roughly September through February. But spring also brings significantly more vendor competition. The current window, while quieter, has the advantage of less competition from other sellers for the buyers who are active. A property that launches now with clear pricing, realistic expectations and strong first-week presentation will often outperform one that launches in spring with poor listing strategy.
Five of Hewett's 10 current listings are under offer despite zero confirmed sales in June — direct evidence that well-positioned properties at the premium end are still finding buyers even in winter conditions.
For a personalised read on your timing and suburb, get in touch with Andrew.
Listing Strategy Mistakes We Are Currently Seeing in the Gawler Market
In a market where buyer volume has eased and stock is rising, how a property is listed and priced has a direct impact on how many buyers even see it — let alone make an offer. Here are the four mistakes currently costing Gawler vendors time and negotiating position.
Will Gawler House Prices Fall? What the Data Can and Can't Tell Us
It's too early to say whether Gawler house prices will fall — June's data raises the question but doesn't answer it. What's confirmed: sales volume dropped sharply from May's 46 to June's 20, while the 3-bedroom median held flat at $700,000. Whether that translates into falling asking prices or simply longer selling times over the coming months isn't yet visible in the data.
The May surge absorbed a significant volume of buyer demand in a very short window. Forty-six homes changed hands in one month — many of them in the mid-tier $650,000–$850,000 range where investor and first-home buyer activity is strongest. That is a concentrated transfer of purchasing power out of the active market.
The wave has broken. What the data cannot yet tell us is what the waterline looks like when it settles.
There are two plausible directions from here — and we are watching both closely.
Direction one: days on market stretch out
With fewer active buyers and more stock on market than is typical for this time of year, properties that launched after the May surge may simply take longer to find their buyer. Vendors who price at the top of their range and wait are likely to discover that patience is more expensive than they expected — particularly as listings accumulate on pages 4 and beyond of realestate.com.au.
Extended days on market is not a crisis signal for the district — it is a normal consequence of a compressed demand event. The buyers who were going to move in the next six months moved in May. The remaining buyer pool is genuine but smaller, and smaller pools move more slowly.
Direction two: pricing adjusts to keep buyers engaged
The alternative is that vendors — particularly those who have been sitting on the market since May — begin to calibrate their price expectations to match the current buyer pool rather than the one that existed two months ago. A modest price adjustment is not a market in distress. It is a market finding equilibrium after a demand event pulled forward transactions that would otherwise have been spread across the next few months.
A buyer who can purchase today at a price that reflects current supply levels may be less likely to hold off than one who perceives the vendor as anchored to May pricing. The question is whether enough vendors make that adjustment voluntarily, or whether the market forces it through extended time on market.
There is a third variable worth naming. Property price falls in Sydney, Melbourne and other eastern capitals have been prominent in national media through 2026. Local fundamentals in the Gawler district do not directly mirror those markets — different price points, different demand drivers, different supply pipelines. But buyer psychology does not always make that distinction cleanly.
A buyer who has read three articles about falling values in other states may hesitate at the moment of committing — not because Gawler's data justifies hesitation, but because the broader narrative creates doubt. That doubt does not need to be rational to affect behaviour. If even a portion of the active buyer pool is sitting back to see whether local prices soften before committing, the effect on open home attendance and offer volumes is real — even if the underlying market is stable.
We don't know which direction yet — and anyone who says they do is guessing
The honest read on the Gawler market right now is that June's data raises the question but does not answer it. One month of 20 sales following a 46-sale surge is not enough to call a trend. July's data will tell us considerably more — whether days on market are genuinely extending, whether asking prices are beginning to soften, and whether the buyer pool is rebuilding or contracting further.
This page is updated monthly with confirmed sales data as it arrives. The July results will be published in early August. In the meantime, if you are a vendor or buyer currently active in the Gawler market and want a read on what the current data means for your specific property or suburb, Andrew McKiggan is available for a free, no-obligation consultation — no forecasts, just the current data applied to your situation.
Gawler House Prices by Suburb — Current Data
Gawler East recorded the most suburb-level sales activity in June 2026 — 6 disclosed sales at a premium-skewed median of $899,500 — while most other Gawler district suburbs recorded too few sales this month to be statistically reliable on their own. With only 20 total sales across the district, the table below should be read alongside the 3-month rolling report for a more statistically reliable suburb-level view.
| Suburb | Recent Median | Sales (Jun) | Reliability | Full Report |
|---|---|---|---|---|
| Gawler East | $899,500* | 6 disclosed | ⚠️ Premium-skewed | Gawler East House Prices |
| Gawler Belt | $1,055,000 | 2 disclosed | ⚠️ Rural acreage only | — |
| Evanston Park | $730,000 | 3 disclosed | ⚠️ Small sample | Evanston House Prices |
| Evanston Gardens | $723,000 | 2 disclosed | ⚠️ Indicative only | Evanston House Prices |
| Willaston | $682,500 | 2 disclosed | ⚠️ Indicative only | Willaston House Prices |
| Evanston | $600,000 | 1 disclosed | ⚠️ Indicative only | Evanston House Prices |
| Hewett | Under Offer (5) | 0 confirmed | 5 of 10 listings under offer | Hewett House Prices |
| Gawler West | n/a | 0 disclosed | ⚠️ Contact Agent only | — |
| Angle Vale | See annual report | — | Annual data | Angle Vale House Prices |
| Munno Para | See annual report | — | Annual data | Munno Para House Prices |
* Gawler East June median pulled upward by the $1,150,000 Cheek Avenue result. Remaining 5 sales ranged $712,500–$932,000. Suburb medians based on June 2026 confirmed disclosed sales only. Updated monthly.
Gawler House Prices by Bedroom — Current Data
A 3-bedroom house in the Gawler district currently sells for a median of $700,000 — unchanged across April, May and June 2026 from 43 combined disclosed sales.
| Bedrooms | Apr 2026 | May 2026 | Jun 2026 | Read |
|---|---|---|---|---|
| 3-Bedroom | $700,000 | $700,000 | $700,000 | ★ Three months — zero movement |
| 4-Bedroom | $815,000 | $970,000* | $755,500 | ⚠️ Swings are composition — use Apr as base |
| 5-Bedroom | — | $1,180,500 | $920,000 | ⚠️ Small samples — includes acreage |
* May 4-bedroom median inflated by premium Hewett concentration.
Three months. Forty-three combined disclosed sales. The three-bedroom figure has not moved a dollar. For vendors with 3-bedroom homes, that is your anchor. For buyers, it is the most defensible reference point available.
